Nowadays there's no way to deal with code issues (read: bugs) without using debugging tools. It's long day gone when var_dump-ing was all you need.
Xdebug allows one to observe the bugs in slow motion and pinpoint the issue easily. It also is a helpful tool to reverse engineer code to understand how it works and how it should be used when there is no documentation.
Along debugging, it enables to trace and profile the application. Tracing aids to get a call stack of what is going on until the specific line of of code (with all of the arguments), whereas profiling allows to delve into performance issues and investigate possible code bottlenecks.
PhpStorm, as an IDE, has a great integration with Xdebug and also allows to read and present the profiling dumps generated by Xdebug profiler.
Installation
Xdebug is a PHP extension and is installed fairly easy. Use your favorite package manager to install, whether it's apt, yum or even built from source via pear.
For those using apt, I strongly recommend using external PPA to manage PHP versions and extensions, as those that are bundled in system packages are rather limited and are updated less frequently. Also there is a limited set of versions to choose from.
Personally I use https://launchpad.net/~ondrej/+archive/ubuntu/php. It covers a wide variety of PHP versions along with the extensions there might be needed.
Assuming php 8.2, type:
$ sudo apt-get install php8.2-xdebug
Check it out and look for Xdebug line:
$ php -v
PHP 8.2.14 (cli) (built: Dec 21 2023 20:19:23) (NTS)
Copyright (c) The PHP Group
Zend Engine v4.2.14, Copyright (c) Zend Technologies
    with Zend OPcache v8.2.14, Copyright (c), by Zend Technologies
    with Xdebug v3.3.0, Copyright (c) 2002-2023, by Derick Rethans
Usage
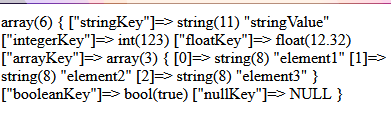
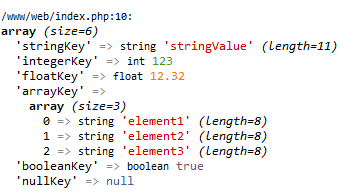
After installing the extension is already usable, hence the var_dump function is now overloaded with Xdebug variant and will output a variable dump in a much more pleasant way.
Hence the sample PHP code:
$a = [
  "stringKey" => "stringValue",
  "integerKey" => 123,
  "floatKey" => 12.32,
  "arrayKey" => ['element1', 'element2', 'element3'],
  "booleanKey" => true,
  "nullKey" => null,
];
var_dump($a);
 |
 |
Step debugging
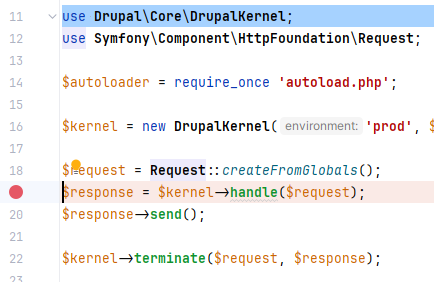
Step debugging is when the code halts execution at specific lines via so-called breakpoints. Breakpoints are set in the PhpStorm IDE one the line we want the code to halt. Do so by clicking on the line with code where the execution should be paused. Empty lines and comments do not allow placing breakpoints.
Now, there are two ways to debug code - from the browser or from the CLI (command line interface). It all depends what application is debugged. Web applications tend to be debugged from the browser, services or PHP scripts from CLI.
Browser debugging
Install the debug helper extension for the desired browser. E.g.: Xdebug Helper for Firefox.
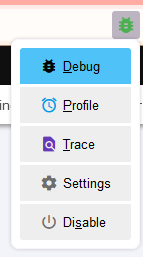
Once installed, it adds a button along the address bar.
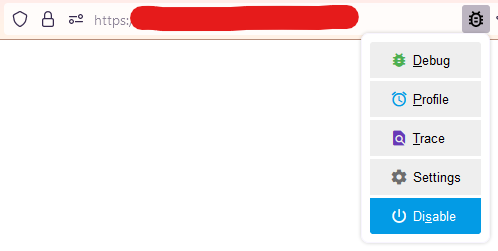
This extension is used to force start a debugging session. Now, it needs to be configured - select Settings. In the browser tab that opened, under the IDE Key, select PHPSTORM and click save.
Next, lets configure the Xdebug extension for debugging our app.
For PHP as FPM, open the /etc/php/8.2/fpm/conf.d/20-xdebug.ini
For PHP as Apache2 module, open the /etc/php/8.2/apache2/conf.d/20-xdebug.ini
Set the following settings (can omit the comments, these are clarification of what each option does):
; All settings start with "xdebug."
; IDE Key - same as in the browser extension setting.
xdebug.idekey = "PHPSTORM"

; How deep structured data can be nested, e.g. objects/arrays.
xdebug.max_nesting_level = 500
; Limit how many children var_dump() displayed during one variable dump.
xdebug.var_display_max_children = 64

; Limit the length of string data var_dump() displayed during one variable dump.
xdebug.var_display_max_data = 2048

; Limit depth of nested data var_dump() displayed during one varaible dump.
xdebug.var_display_max_depth = 5

; Enables xdebug possibilities.
; develop - overloads the var_dump, provides error trace, etc.
; debug - enables step debugging
; profile - allows collecting profiling data
; trace - allows collecting trace information
; SEE https://xdebug.org/docs/all_settings#mode
xdebug.mode=develop,debug,profile,trace

; Automatically resolve debugging party IP.
; I.E. Where the debugging client (PhpStorm in our case) is located
; This will attempt to connect to any party that initiated the debug session
; which is not recommended for PROD env and okay for local/dev env.
; We can disable/comment this and explicitly set the IP of the
; client waiting for xDebug session (see below).
xdebug.discover_client_host=true

; Set explicitly the client host that is eager to start a debug session.
; xdebug.client_host=192.168.56.1

; Only start debugging session when triggered.
; The trigger is the option selected in debugging helper browser extension
; or an env variable, when debugging via CLI.
; One can set to start a debugging session for each request by setting 'yes'.
; See https://xdebug.org/docs/all_settings#start_with_request
xdebug.start_with_request=trigger
Note: Having Xdebug extension enabled on production is always a bad idea.
Save the file and restart either PHP-FPM:
$ sudo /etc/init.d/php8.2-fpm restart
# OR
$ sudo service php8.2-fpm restart
... or the Apache2:
$ sudo /etc/init.d/apache2 restart
# OR
$ sudo service apache2 restart
Now, enable step debugging in the browser helper extension and place a breakpoint somewhere in the code in the PhpStorm IDE.
|
|
Also in the IDE, enable listening for debug connections by clicking on the "bug" button so it goes "green". 
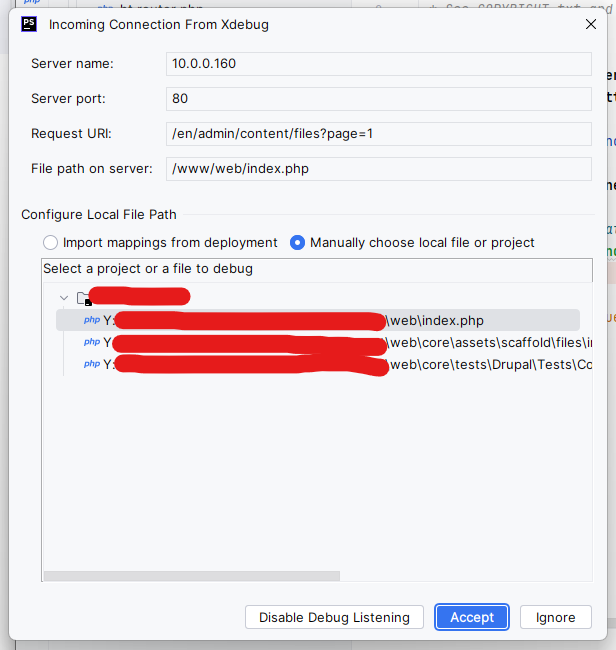
Open the application in the browser and navigate to the page that would reach the line where breakpoint was placed. When the project is debugged for the first time a window would appear. Click "Accept".
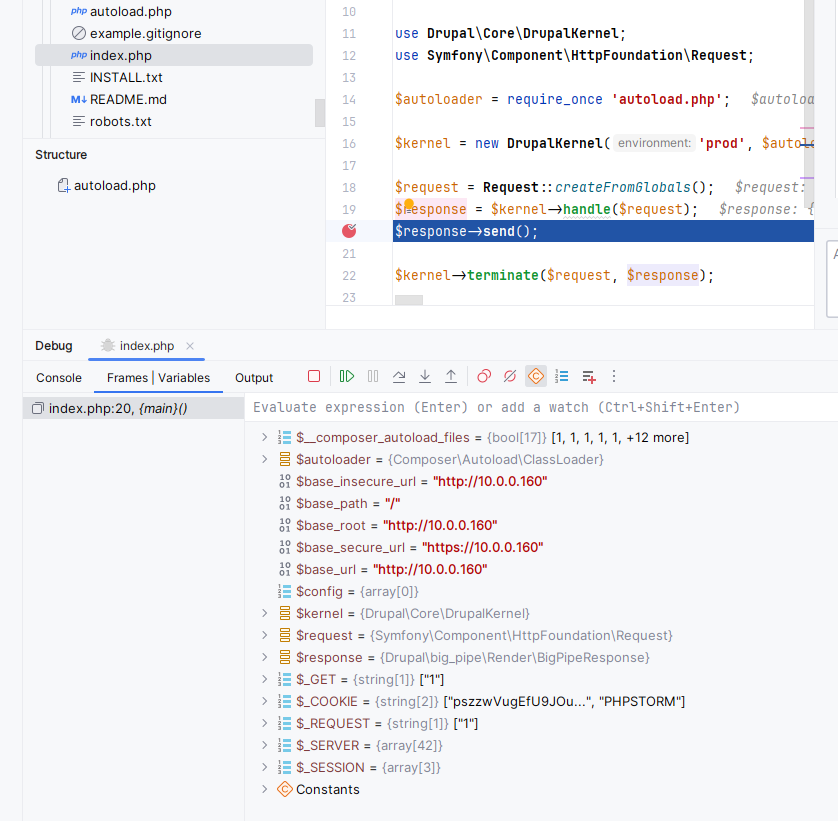
Observe that execution is halted on the line where breakpoint was placed.
CLI debugging
Since PHP uses different set of configuration files for FPM/Apache and CLI runtimes, configure the Xdebug extension same way as did above, but this time in the following file - /etc/php/8.2/cli/conf.d/20-xdebug.ini
Use same settings, except comment the xdebug.discover_client_host settings and uncomment xdebug.client_host. Assing the latter your local IP address.
If the web-server and PhpStorm are started on same machine, use localhost or 127.0.0.1. If web-server is located on a remote machine or on a virtual one (VirtualBox, Docker, etc.), set the IP address of your host machine and make sure it is reachable from the guest/vm. Check that by trying to ping your host machine from the guest/remote one.
In case of VirtualBox, it assigned an ip of 192.168.56.1 to my host machine. I can easily ping this IP from the vm. Therefore, I've used this IP as the xdebug.client_host value.
xdebug.idekey = "PHPSTORM"
xdebug.max_nesting_level = 500
xdebug.var_display_max_children = 64
xdebug.var_display_max_data = 2048
xdebug.var_display_max_depth = 5
xdebug.mode=develop,debug,profile,trace
xdebug.client_host=192.168.56.1
#xdebug.discover_client_host=true
xdebug.start_with_request=trigger
When running PHP scripts from command line (terminal) there is no extension to trigger the debug session. The debug session is triggered using and environmental variable XDEBUG_SESSION=1. Also make sure to set the PHP_IDE_CONFIG setting to serverName=YOUR_SERVER_NAME.
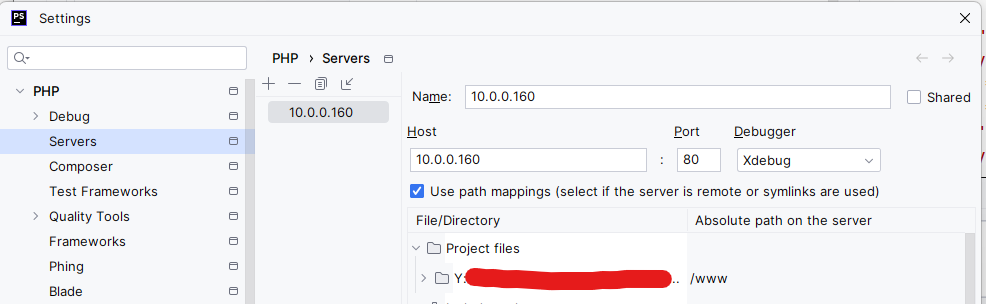
Replace the YOUR_SERVER_NAME to the name of the server setting taken from PhpStorm File -> Settings -> PHP -> Servers.
If using remote debugging make sure to check Use path mappings checkbox and validate the mapping between your yur local sources and remote location so PhpStorm can properly map the location of files when debugging and open the correct one.
Usually mapping the root directory of the sources on the remote/vm machine to your host location of sources is enough.
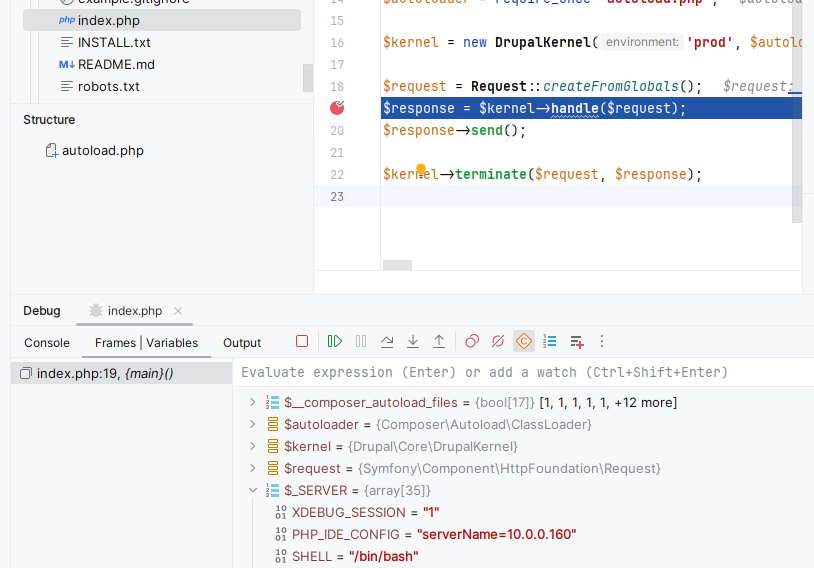
Enable the listening (if not already) of debug session in PhpStorm (the "green bug" button) and start initiate the debug session:
$ XDEBUG_SESSION=1 PHP_IDE_CONFIG=serverName=10.0.0.160 php index.php
The execution should halt on same line where breakpoint was set, but this time the debug session was triggered from the CLI.
Happy debugging!
- Log in to post comments